Introduction
The goal of this project was enabling smart management of my home comfort from anywhere. This is monitoring or adjusting heating temperatures via computer, smartphone or tablet, so being able to check the heating status, change target temperature or the daily and weekly programming using a user-friendly interface. A secondary, but equally important goal of the project was the thermostat exterior design and the solution engineering. I wanted the electronic circuit to fit the size of a masonry wall box and the human interface (display and commands) to fit the shape and the size of some civil series. The final result is the following:
Project components
The thermostat is based on the well-known ESP8266 which includes a built-in Wi-Fi controller and very good computational capabilities with 80Mhz clock CPU, 80Kb of RAM and 4Mb flash storage for program code and data.
The project hardware includes a sensor to monitor ambient temperature and humidity) and a subminiature power latching relay to switch heating on or off.
The thermostat human interface includes a small 1.3″ OLED display to show the basic information like temperature, humidity, working mode and status. A small 5-way joystick is used to interact with the thermostat local interface for example to change the working mode and modify various thermostat configuration options.
A small SMPS provides the regulated 3.3v source required to operate the ESP8266 and all the other components.
Other than the local interface, the thermostat can be monitored and configured remotely using a web application interface. Advanced configuration options like changing the daily and weekly temperature programming are only available using the web interface.
Thermostat block diagram
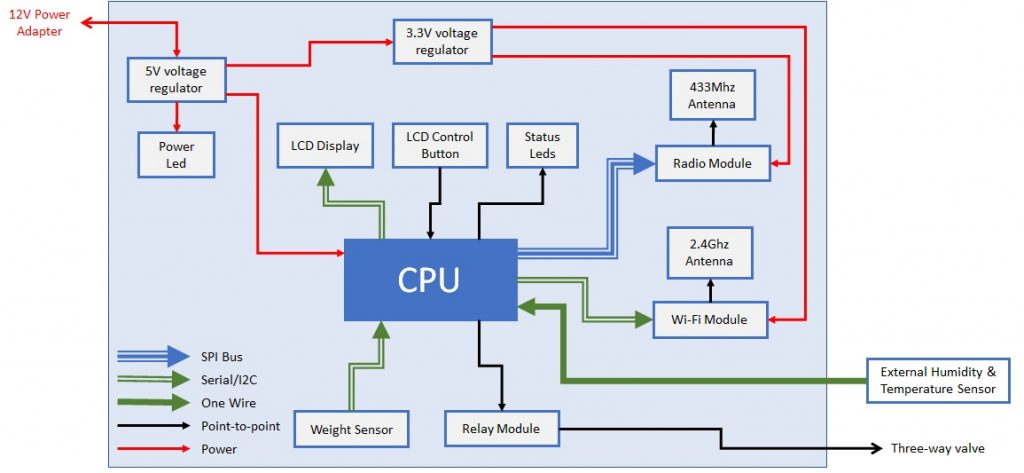
Following picture shows the thermostat block diagram:
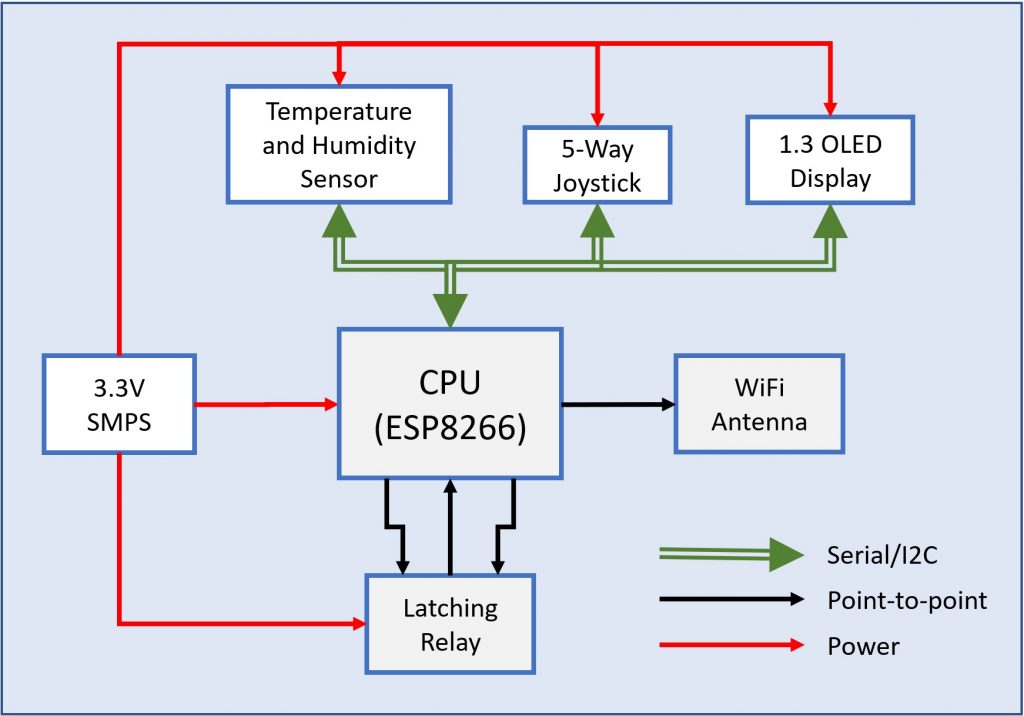
The I2C bus connects the temperature/humidity sensor, the OLED display and the 5-way joystick to the CPU. The latching relay is connected directly to the CPU using two control pins (to switch the relay contact ON or OFF – double coil relay) and a feedback pin. The feedback pin is used to check the relay status at system startup and verify that the latching relay contact is switched on the correct position (see “Latching Relay Status Feedback Management” section later on for details).
The thermostat features are the following:
- Operating mode:
- Auto: the thermostat automatically switches the heating system on or off comparing the ambient temperature and the target temperature set by the user.
- Away: the thermostat normal status is off but it switches on the heating system if ambient temperature goes below the freezing temperature which is set to 5 degrees Celsius.
- Cleaning: the thermostat switches off for 3 hours from the moment this mode is activated and then reverts back to the Auto mode. This is especially useful to avoid the heating system to switch on in winter time when opening windows during housekeeping time.
- Manual: the thermostat is activated manually setting the target temperature to the desired value.
- Off: the thermostat is switched off.
When is Auto mode, the target temperature is set according to a program of the day which defines the target temperature with a resolution of 30 minutes. There are up to three different programs that can be set and associated with the days of the week. Usually, just two programs are used one for Monday to Tuesday and the second program for the weekend. A third program is available for different needs.
User interface
The thermostat is connected to internet through the home Wi-Fi connection. Programming the thermostat can be done either by the local interface (thermostat joystick on the right hand side of the display) or the remote web interface. The local interface allows the user to switch between the different operating modes and change main settings of the thermostat. The web interface allows the user to monitor the thermostat status, change the operating mode or modify the weekly programming used by the Auto mode. Web interface interaction with the thermostat make use of the long polling technique (see “Remote Interface Interaction” section below for details).
Some features are only avaliable by the local or remote interface, here is the list:
| Feature | Local Interface | Web Interface |
|---|---|---|
| Change operating mode | X | X |
| Set target temperature in manual mode | X | X |
| Change weekly programs | X | |
| Associate Weekly program to Days | X | |
| Adjust thermostat internal configuration parameters | X | |
| Monitor ambient temperature | X | X |
| Monitor ambient humidity | X | |
| Advanced monitoring of temperature/humidity history (day/week/month/year) | X | |
| Set target end of time in cleaning mode | X | X |
The local interface has two pages:
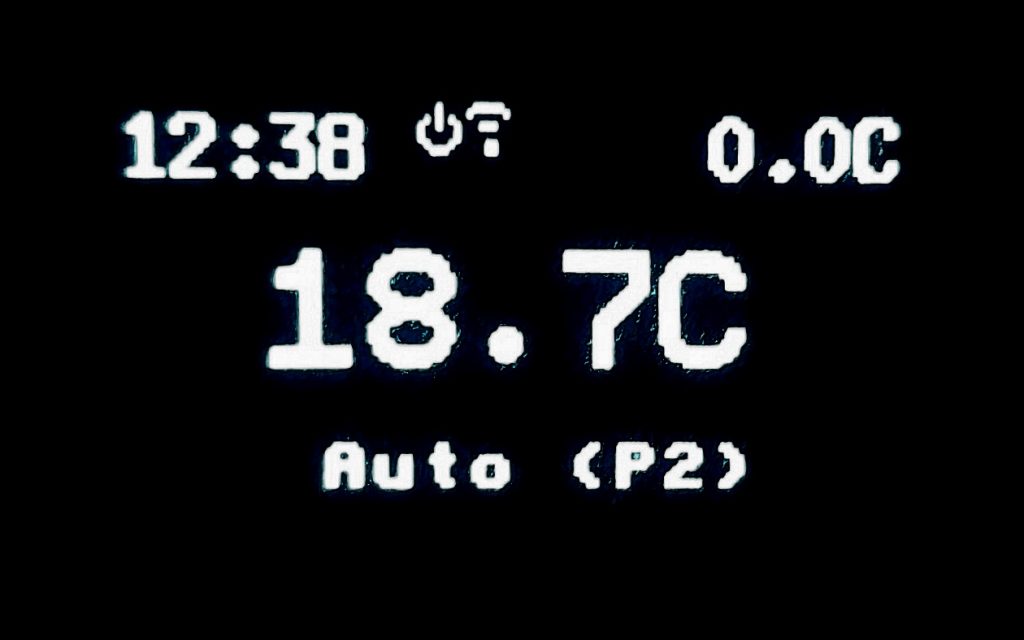
- Main screen: here you have the time on the upper left corner, then some icons showing the heating status (on/off), the Wi-Fi connection status. The target temperature is on the upper right corner while current temperature is at the center of the display. Finally, on the bottom you can see the operating mode.
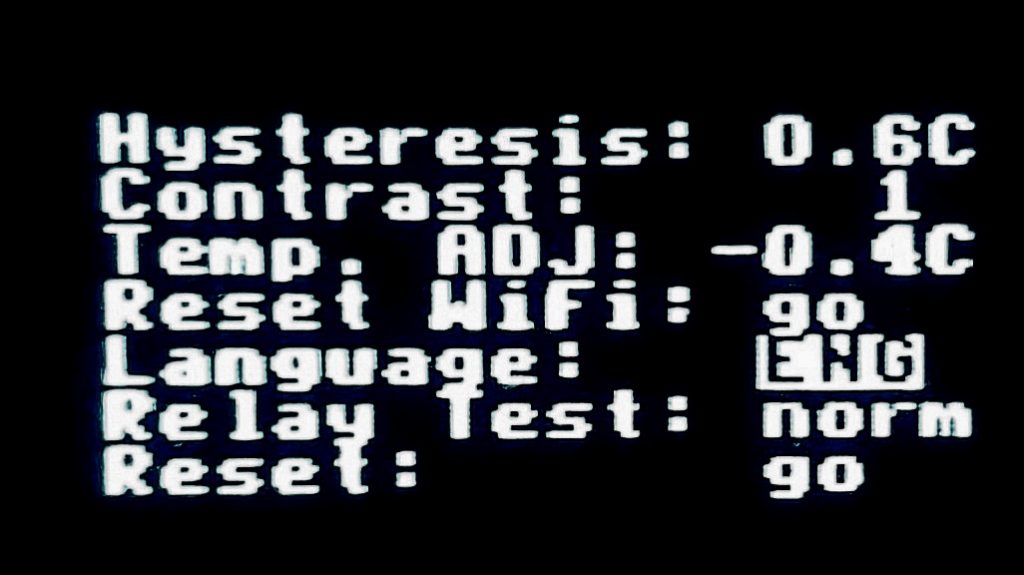
- Settings screen: here you can change the internal configuration of the thermostat. These include:
- Hysteresis: this is the minimum difference between the target temperature and current temperature that must exist to switch heating on again after the target temperature has been reached.
- Contrast: the display brightness
- Temp. ADJ: this is the temperature adjustment offset from -2 to 2 degrees Celsius used for temperature sensor fine tuning.
- Reset WiFi: to restart Wi-Fi and put the thermostat in hotspot mode. This way, you can connect a smartphone or tablet to the thermostat and enter Wi-Fi connection parameters (ssid, key).
- Language: the local and remote interface display language. English and Italian are supported, more to come.
- Relay Test: used to force the heating relay on or off for testing purposes.
- Reset: to restart the thermostat.
To enter the settings page from the main page you need to keep the joystick button pressed for more than 3 seconds.
On the settings page you can browse the configuration options up and down using the joystick. Once you have selected the desired option you can enter into the change mode moving the joystick in the right direction. When the option value is highlighted you can change its value moving the joystick up and down. To leave the change mode just move the joystick in the left direction.
To go back to the main page keep the joystick pressed again for more than 3 seconds.
Here are the screenshots of the display pages:
The web interface has three tabs:
- Home: here you can set the operating mode, check ambient temperature and humidity, explore their trend through an interactive graph (pan/zoom) over the last day/week/month/year
- Week: here you can switch the program associated to the days of the week
- Programs: here you can change the daily program setting the desired temperature for each time of the day. You can set up to three programs and the time resolutiin is 30 minutes.
Here are the screenshots of the tabs:

The operating mode is selected using the button on the upper left side. When the operating mode is manual, the slider can be used to set the target temperature.
On the center of the page you have the heating status (on/off) and ambient temperature and humidity. On the bottom of the page, the temperature and humidity graph is interactive. You can select the reference period using the button below the graph and then pan and zoom on the time axis to refine the analysis window.
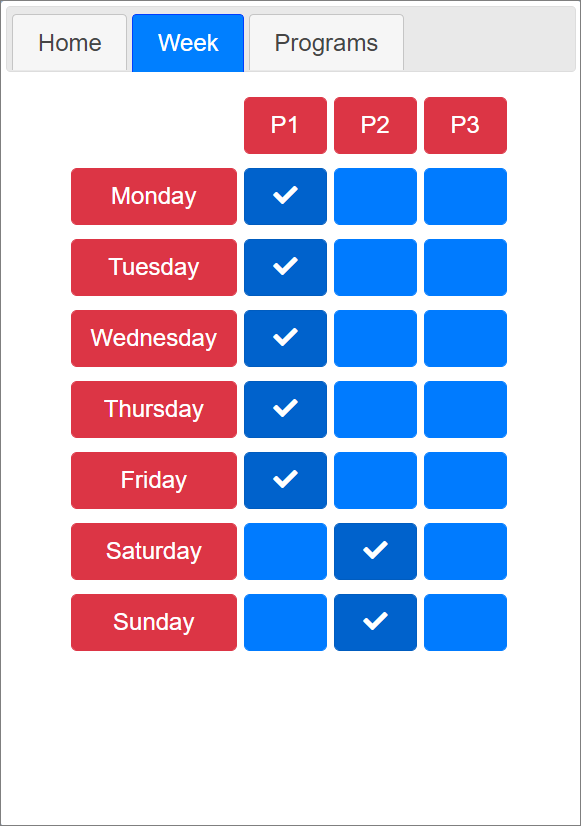
The week tab is very simple you can select the program applied to each day of the week.
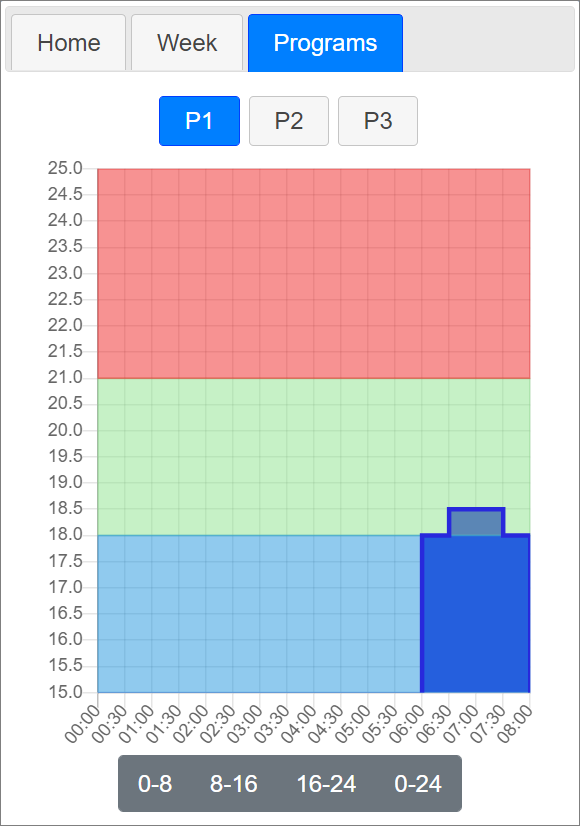
On the top of the page you can select the program to be configured. The bar graph allow you to set the target temperature at every time of the day. You can focus a specific period of the day using the buttons below the graph, then you can pan and zoom on the time axis to focus on specific hours of the day. Finally, clicking on the graph you can adjust the target temperature.
Thermostat internals
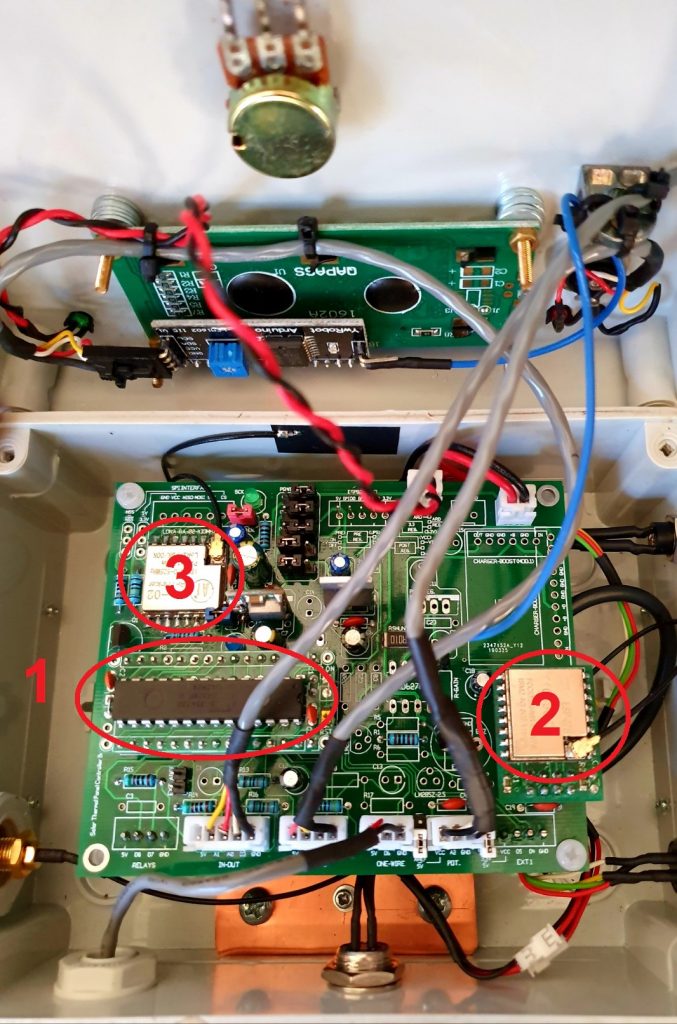
The thermostat is composed by the controller board, the i/o board which embeds the temperature and humidity sensor and the OLED display.
Following picture shows the main board in a early stage of the assembly. The size of the board is 68mm x 48mm:
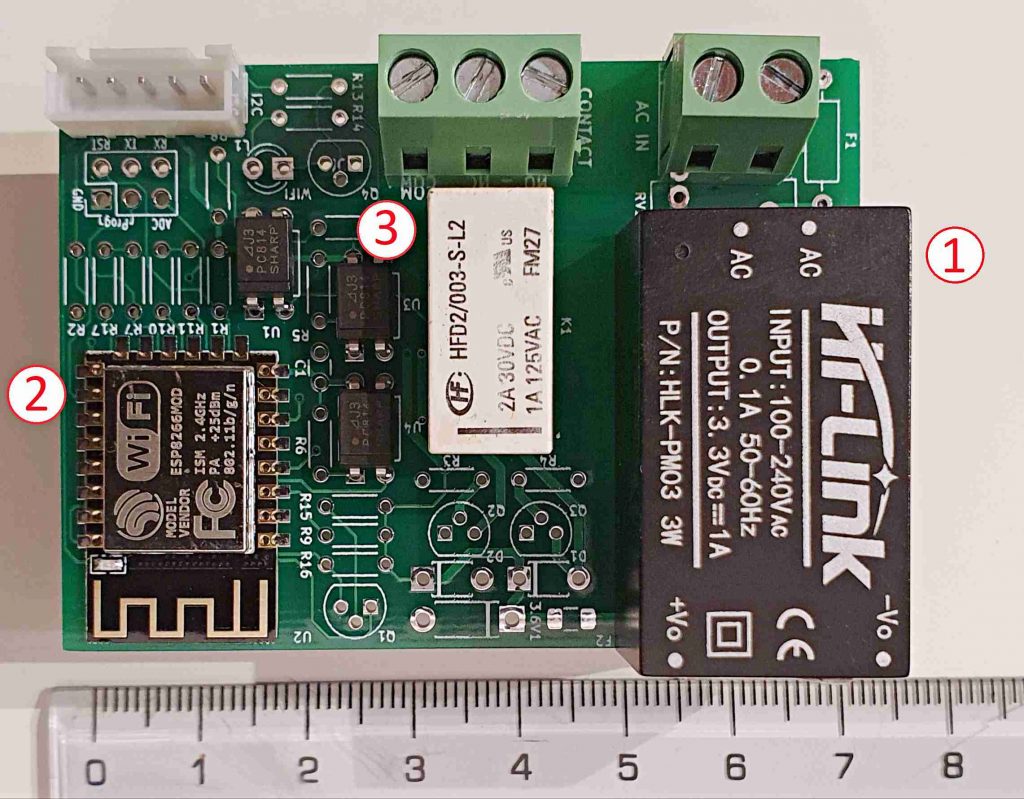
Main components of the board are the (1) AC-DC SMPS converter (Hi-Link HLK-PM03 – see ref. [1]) that provides 3.3v regulated output, (2) the ESP 12-F WiFi module based on ESP8266 CPU (see ref. [2]) and (3) the latching relay that provides NO/NC contacts to switch the heating system on or off.
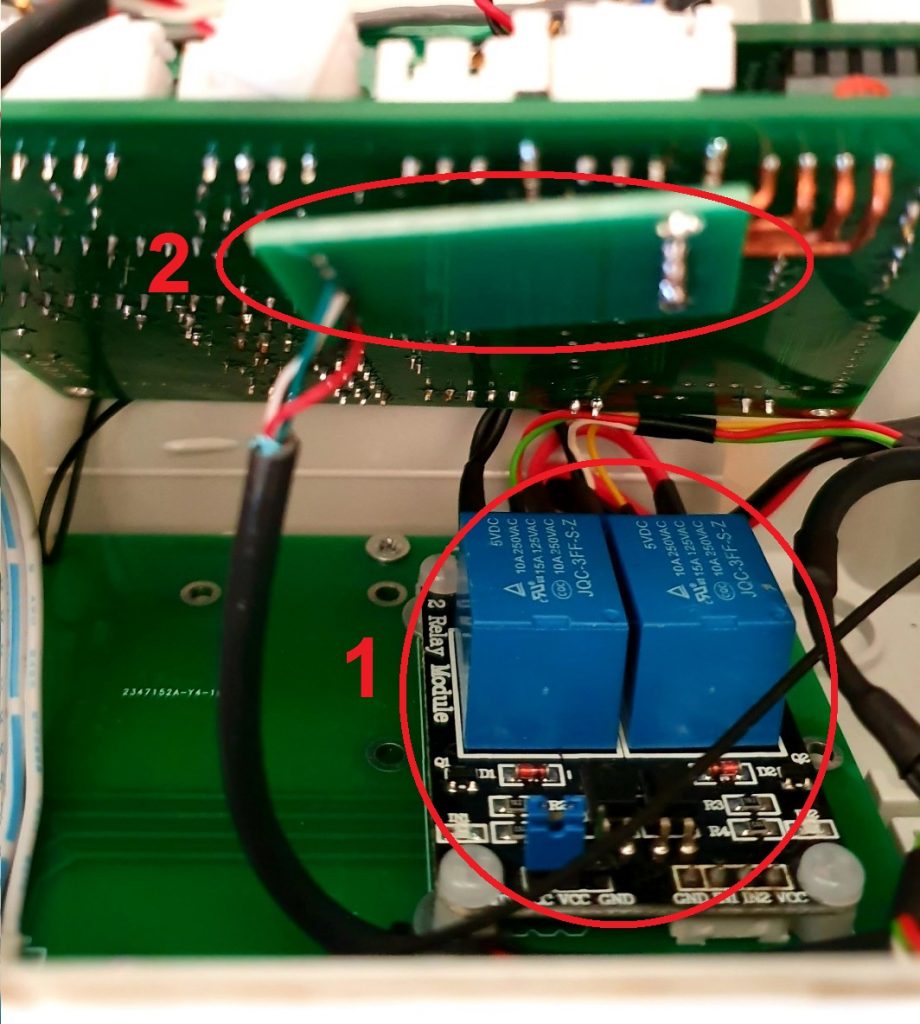
Latching relay is the subminiature dip relay HFD2-003-S-L2 (see ref. [3]) which has double coil and a nominal voltage of 3v. It can switch 125Vac/1A resistive load while the maximum rating is 220Vac/250Vdc at 3A. This is more than enough to drive typical heating system switching contact that is usually either a mechanical or solid-state relay. This latching relay offers two contacts, the second one is used to check the status of the relay and detect possible switching failures.
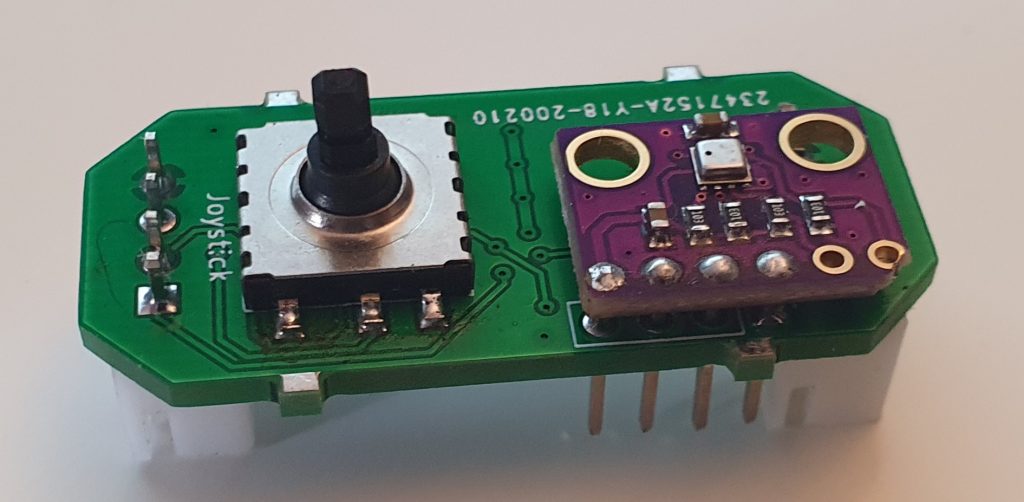
The I/O interface is composed by the joystick and the temperature sensor. This is connected to the main board using the I2C interface. The joystick has five contacts, one for the push button and four for the move directions. The joystick contacts are connected to the I2C bus using PCF8574 Remote 8-Bit I/O Expander (see ref. [4]). The temperature sensor is the well-known Bosh BME280 (see ref. [5]) which provides a native I2C bus connection. Here is a picture of the I/O board.
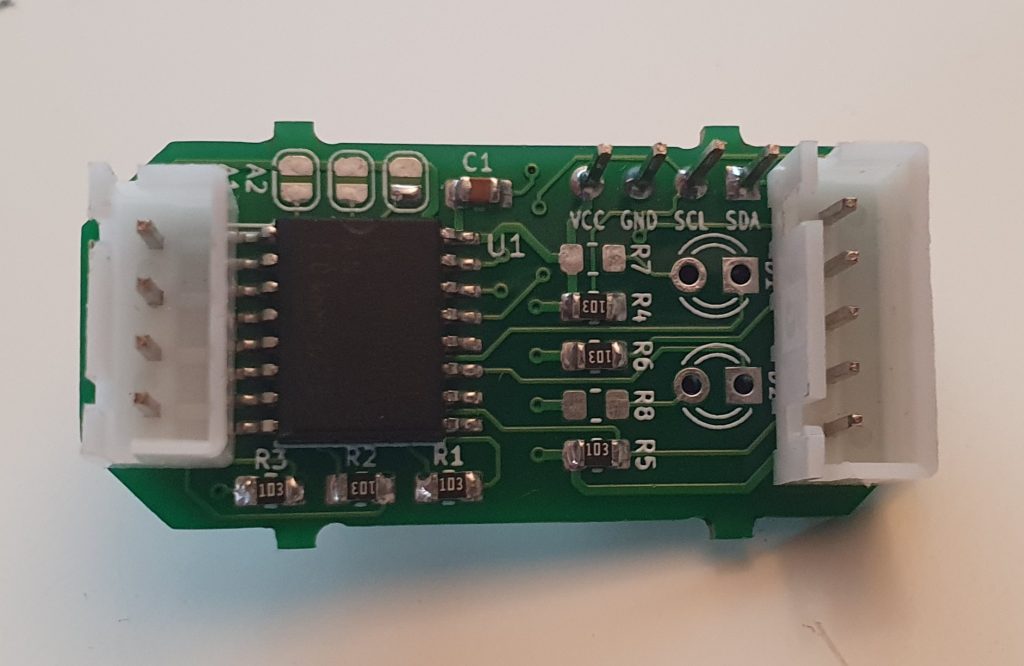
The back side of the board hosts the PCF8574 IC and two I2C connectors, one is used to connect the I2C bus to the main board and the other one is used as I2C bridge to the OLED display. Please, note that the I2C connector to the main board has an additional interrupt pin to notify a change of the joystick status and avoid polling for I/O changes. This is provided directly by the PCF8574 IC.
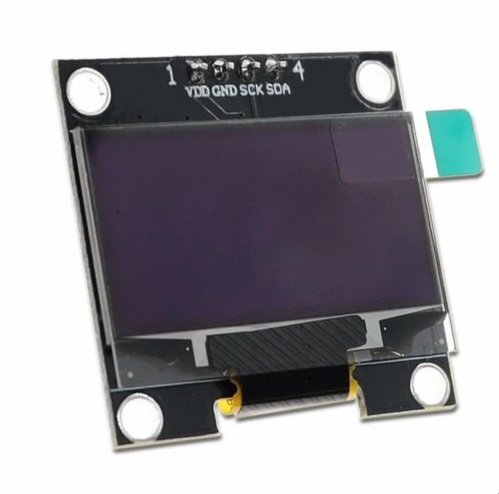
Finally, the display is an 1.3″ monochrome OLED with I2C bus interface based on SSD1306 IC (see ref. [6]) that can be found for a few coins on many e-commerce sites:
Remote Web Interface and local interface Interaction
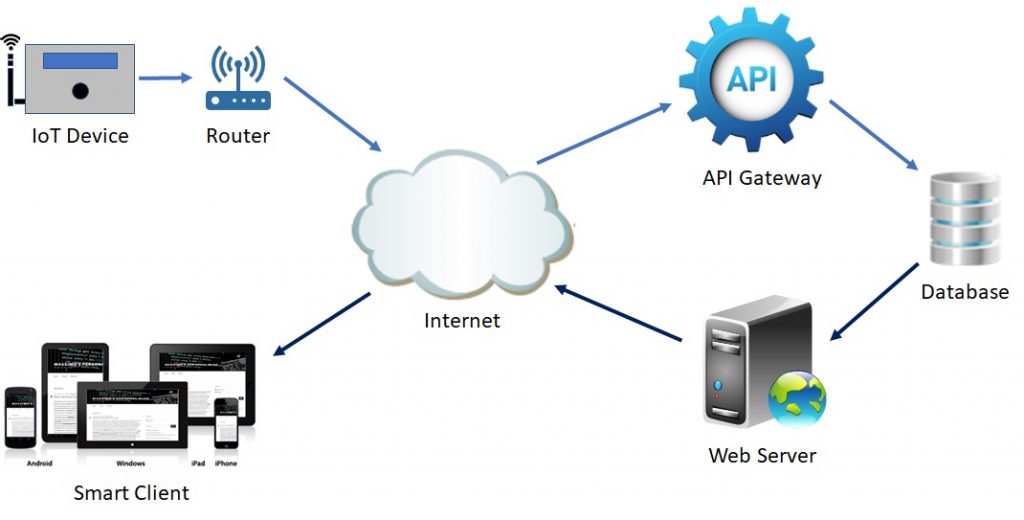
Following diagram shows the interconnections between a remote web interface (operated by the Smart Client), the local thermostat interface and the central components (API Server, Web Server and configuration database):
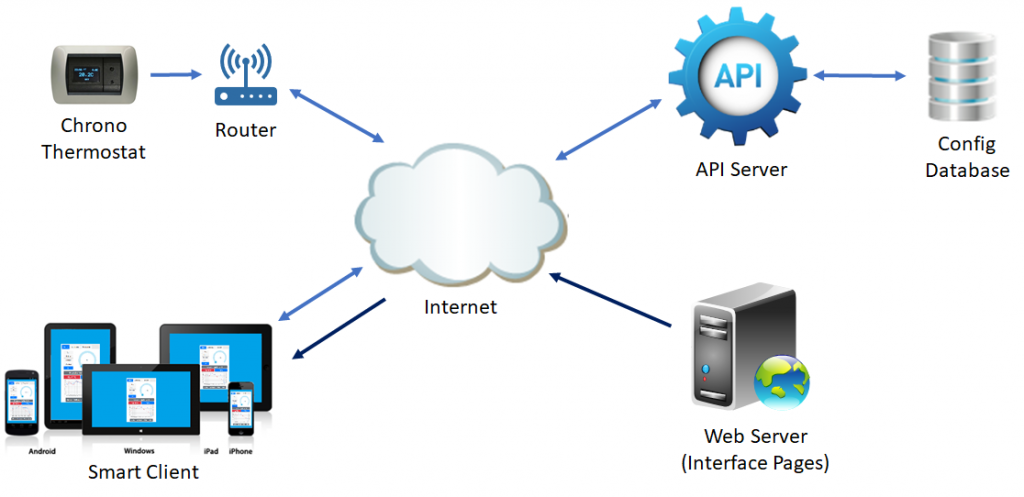
The pages of the remote web interface are provided by the Web Server. The API Server exposes web services to update the thermostat configuration parameters, read the current configuration and poll for configuration changes. Configuration is stored both remotely in the configuration database and in the local thermostat flash storage. Web pages downloaded bu the Smart Client embed the JavaScript code that interact with API Server to read the current configuration, check for configuration changes or update the configuration in case the user changes thermostat parameters (e.g. the operating mode or the target temperature). Configuration changes can be originated either from the Smart Client via the web interface or from the Chrono Thermostat via the local interface. In both cases, the new configuration is first sent via the API Server to the configuration database and then propagated to the other party.
To check for configuration changes both the remote web interface and the thermostat local interface make use of the Long Polling technique. Basically, the client makes an asynchronous call to the API Server which lasts up to 10 seconds (maximum polling interval). In case the configuration doesn’t change during the polling interval, a “no configuration change” response code is sent to the client at the end of the interval. If a configuration change is detected during the polling interval a “configuration changed” is immediately returned to the client along with the new configuration. This way, the frequency of the polling is highly reduced with respect to the continuous polling techniques (in case of no configuration changes, the frequency will be 6 pools for minute with 10 seconds polling interval), while the client is notified almost immediately when the configuration changes.
Next Steps
Possible evolutions of this project include:
- Using Web Sockets in place of Long Polling for remote interface interaction will remove the need of the central configuration database. In this scenario, the remote interface would interact directly with the thermostat.
- Adding a 868/433Mhz radio module (e.g. LoRa Ra-02 or similar) would allow the thermostat to act as a central hub for peripheral automation modules. For example, controlling thermal actuators, additional temperature/humidity monitoring devices, irrigation valves, and so on. Using low power radio will allow the peripheral devices to be battery powered.
- At present, the thermostat retrieves current time from NTP servers once it is connected to internet. It does not startup until current time is set. In case of temporary power outage, if the internet connection is not reestablished, the thermostat will not work. Adding a RTC (Real Time Clock) module with a backup battery to keep time synchronized would solve this problem.
- In addition to multi-language support, it would be useful adding some localization features like Celsius vs. Fahrenheit and different time formats
References
@hlk_pm03{hlk_pm03,
author = "HiLink",
title = "{HLK-PM03 3.3V 3W Power module description and Datasheet}",
year = "2020 rev. 1.01"
}@hlk_pm03{esp_12f,
author = "Ai-Thinker Technology",
title = "{ESP-12F WiFi module}",
year = "2018"
}@hfd2_003_S_L2{hfd2_003_S_L2,
author = "HONGFA",
title = "{HFD2 Subiminiature DIP Relay}",
year = "2020 rev. 1.01"
}@pcf8574{pcf8574,
author = "Texas Instruments",
title = "{PCF8574 Remote 8-Bit I/O Expander for I2C-Bus}",
year = "2015 rev. J"
}@bme280{bme280,
author = "Bosch",
title = "{BME280 Combined humidity and pressure sensor}",
year = "2018 rev. 1.6"
}[Bibtex]
@ssd1306{ssd1306,
author="Solomon Systech",
title = "{128x64, Dot Matrix OLED/PLED Segment/Common Driver with Controller}",
year = "Sep. 2019"
}